Rosewood Castiglion del Bosco Villa Sant’Anna
Property Description
Rosewood Castiglion del Bosco — Villa Sant'Anna
Property Highlights
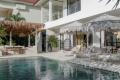
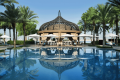
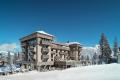
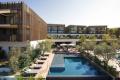
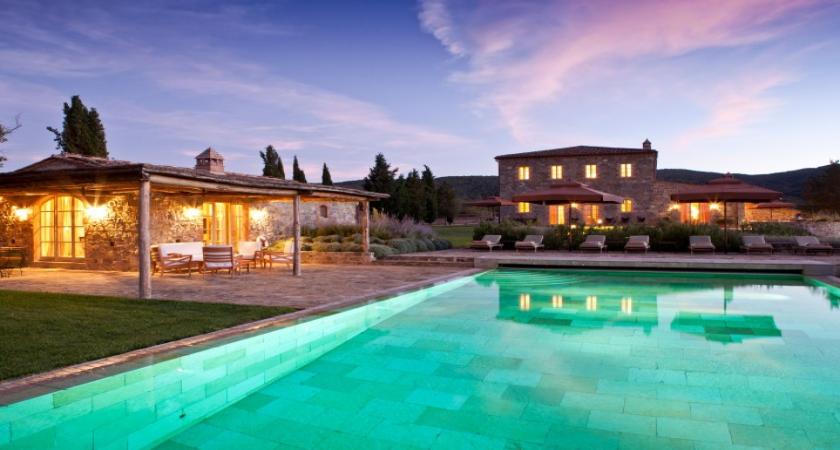
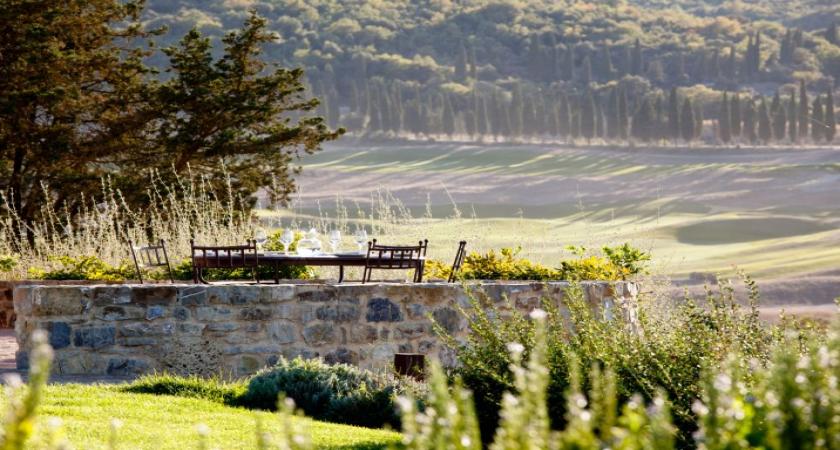
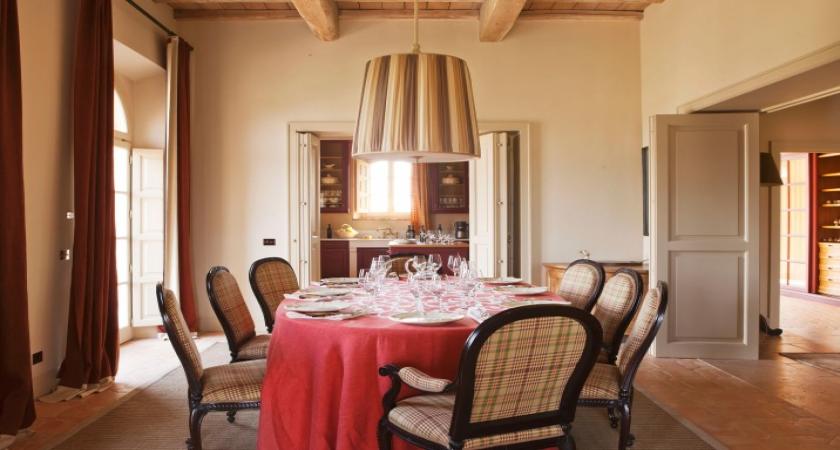
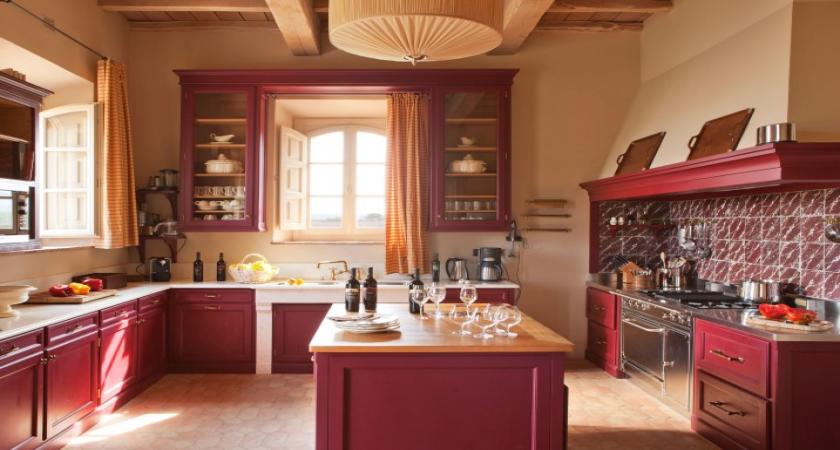
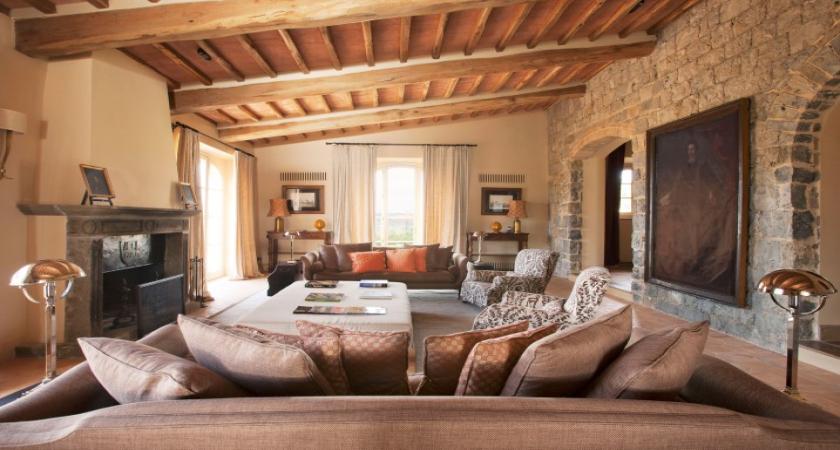
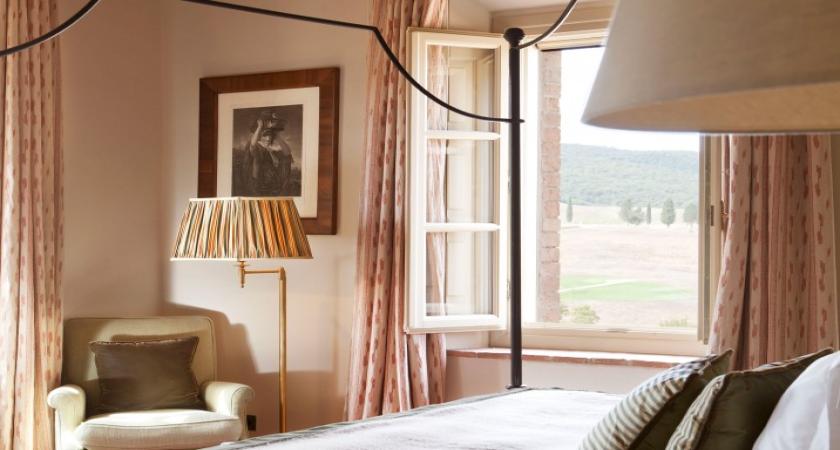
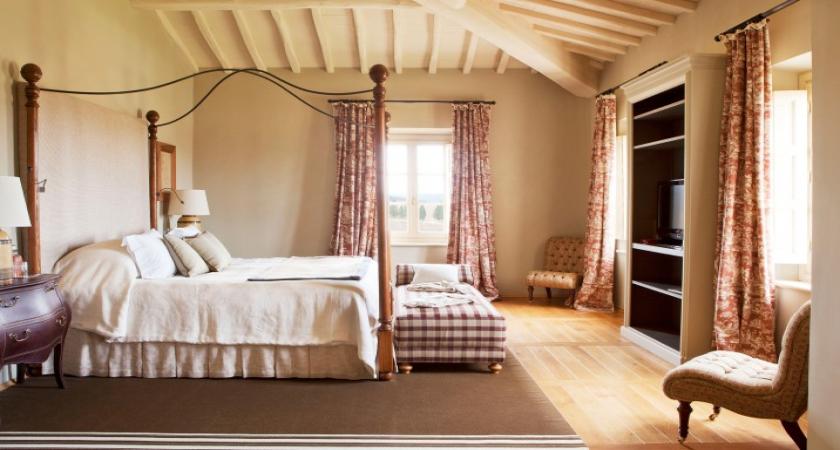
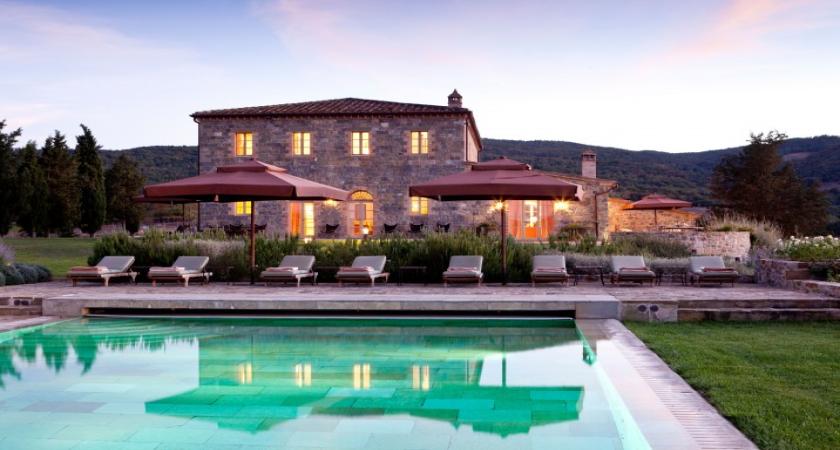
Set amid the vineyards and rolling hills of the UNESCO-listed Val d’Orcia, Villa Sant’Anna is a 655 sqm traditional Tuscan farmhouse with a private infinity pool, tennis court, pool-house, and panoramic views of the estate’s golf course and Sangiovese vineyards. The villa benefits from Rosewood’s hospitality services and a strong golf & wine tourism draw.
Top Features5 bedrooms • Sleeps 9 • Private pool
- Private 98 sqm infinity pool with vineyard & golf course views
- Private tennis court and outdoor pizza oven
- Full access to Rosewood Castiglion del Bosco amenities (spa, concierge, winery experiences)
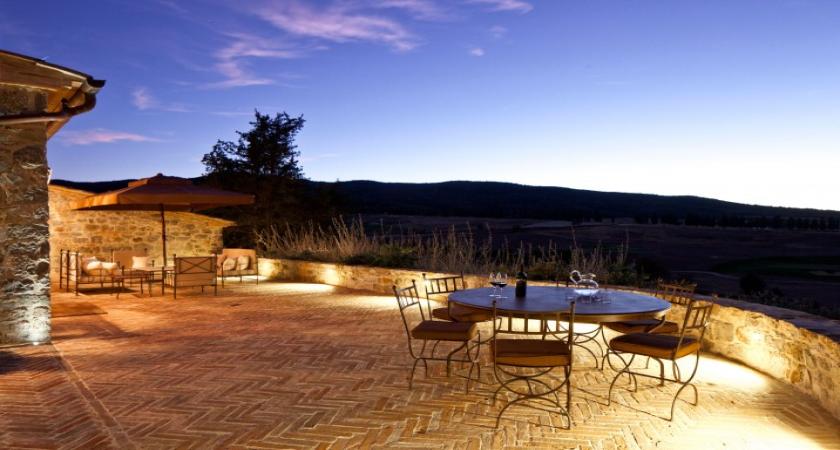
- Large gardens, multiple alfresco dining terraces and pool house
Seasonal Occupancy Model
Model summaryPeak, shoulder & low-season split
| Season | Months | Avg Occupancy | Weighted Nights |
|---|---|---|---|
| Peak | May–Sept | 70% | ~107 nights |
| Shoulder | Apr & Oct | 40% | ~24 nights |
| Low | Nov–Mar (limited) | 10% | ~2 nights |
| Total (approx.) | ~133 nights (≈58% avg) | ||
Revenue & Earnings (Estimates)
Seasonally-weighted revenueGross → Net (30% op costs)
| Metric | Range (€) |
|---|---|
| Annual Gross Revenue | €2,037,000 (approx) |
| Operational Costs (≈30%) | €611,000 (approx) |
| Net Earnings (Estimated) | €1,425,000 (approx) |
Notes: figures are estimates based on the agreed seasonal occupancy model. Actual performance will vary with market conditions, pricing strategy, and operational factors.
Ownership & Allocation
Revenue splitOwners 35% • Ark 10% • Investors 55%
| Stakeholder | % of Net Earnings | Estimated Allocation (€) |
|---|---|---|
| Property Owners | 35% | — (35%) |
| Arkimmobilier™ | 10% | — (10%) |
| Investor Pool | 55% | €742,500 – €797,500 |
Owner and Ark allocations are intentionally anonymised in payout figures — percentages are indicated above.
Capitalization & Share Structure
Final offering€1,000,000 cap • 400 shares
| Item | Detail |
|---|---|
| Total Capitalization | €1,000,000 |
| Total Shares | 400 |
| Price per Share | €2,500 |
| Investor Ownership of Net | 55% |
Returns & Example Investor Positions
Per-share & example positionsProjected distribution ranges
| Metric | Range / per share (€) |
|---|---|
| Investor Pool (Annual) | €742,500 – €797,500 |
| Annual Return per Share | €1,856.25 – €1,993.75 |
| Annual ROI per Share | ~74% – 80% |
| 5-Year Cumulative per Share | €9,281.25 – €9,968.75 |
Per-share Income Breakdown (est.)
| Period | Per-Share Range (€) |
|---|---|
| Daily | €5.09 – €5.46 |
| Weekly | €35.70 – €38.34 |
| Monthly | €154.69 – €166.15 |
| 6 Months | €928.13 – €996.88 |
| Yearly | €1,856.25 – €1,993.75 |
Example Investor Positions
| Shares | Invested (€) | Est. Annual Return (€) | 5‑Year Total (€) |
|---|---|---|---|
| 1 | 2,500 | 1,856.25 – 1,993.75 | 9,281.25 – 9,968.75 |
| 5 | 12,500 | 9,281.25 – 9,968.75 | 46,406.25 – 49,843.75 |
| 10 | 25,000 | 18,562.50 – 19,937.50 | 92,812.50 – 199,375.00 |
| 20 | 50,000 | 37,125.00 – 39,875.00 | 185,625.00 – 199,375.00 |
Risks & Notices
All figures are estimates and for information only. Projected earnings are based on the agreed seasonal occupancy model and a 30% operational cost assumption. Factors that could materially affect outcomes include changes to tourism patterns, golf event schedules, local regulation and taxation, exchange-rate movements, and unexpected maintenance or closure periods. Capital appreciation is not included in the distributions above.
Location
Share now
€2,500.00 EUR
Per share amountLatest Properties